 |
Rockville
City Elections 2001
Election Analysis |
|
Alternatively, you may also view this document
by selecting one of the following files.
elec2001.doc
(Microsoft Word Document, 209KB)
elec2001.pdf
(Adobe Portable Document Format, 295KB)
The vote tallies and calculations used in this report are available in the
following file.
elec2001.xls
(Microsoft Excel Spreadsheet, 24KB)
|
Roald A. Schrack
Overview
The 2001 Rockville Election has generated more participation than any since
1987. The following table shows registration and the number of ballots cast in
the elections since then. Previous Voters are the number of people registered
who have voted in some previous election. New Registration is the number of
people that have been registered since the 1999 election. The ratio of Ballots
to Registration (B/R) is a good indicator of citizen interest and participation
in an election.
| Year |
Ballots |
Registration |
B/R |
Previous
Voters |
New
Registration |
| 1987 |
8056 |
23,601 |
.34 |
|
|
| 1989 |
6206 |
23,546 |
.26 |
9394 |
2258 |
| 1991 |
5451 |
20,648 |
.26 |
7916 |
1741 |
| 1993 |
1449 |
23,077 |
.06 |
9889 |
4409 |
| 1995 |
4323 |
22,787 |
.19 |
8133 |
1317 |
| 1997 |
5211 |
22,660 |
.22 |
6968 |
3299 |
| 1999 |
4690 |
22,676 |
.21 |
6898 |
1451 |
| 2001 |
6967 |
*24,423 |
.28 |
6704 |
3820 |
*There is some confusion about the total registration this year. The county,
who maintains our Registration lists, has tagged 1820 registrants as inactive. I
do not believe that the inactive were included in the registration lists
supplied to the city in previous elections. 90% of those marked as inactive had
not voted in any city election since 1991. The City list shows 26,530 registered
voters. If that number is used the B/R ratio is only .26. The figure below shows
the B/R for elections since 1985. Aside from the highly contested 1987 election
race between Duncan and Van Grack with a B/R of .34,the B/R ratio shows a weak
dependence on the number of council candidates. The 1995 and 1999 data show the
damping effect of rain on voter turnout. November 6, 2001 was a very pleasant
day in contrast to election day in 1999.
This graph shows the participation (B/R), previous voters, and new
registrants. Note the 4-year period in new registrants caused by the intervening
presidential elections. The gradual drop in previous voters is probably due to
the decline in B/R.
This is a self-reinforcing trend. Experienced voters are more likely to vote
in any election, as their number declines then the B/R for an election will tend
to decline.
The following table shows the relation of absentee ballots cast to polling
place ballots for the past several elections.
| Year |
Absentee
Ballots |
Absentee_ballots/
Polling_Place_ballots |
| 1989 |
175 |
.028 |
| 1991 |
168 |
.032 |
| 1993 |
48 |
.033 |
| 1995 |
180 |
.042 |
| 1997 |
156 |
.031 |
| 1999 |
171 |
.038 |
| 2001 |
213 |
.030 |
The relative number of absentee ballots is a good indication of the interest
in an election. Since most absentee ballots are obtained and cast several days
before an election, their number can be used to predict the turnout on election
day. On good weather election days the average ratio is about .03, if there is
rain the ratio raises to about .04.
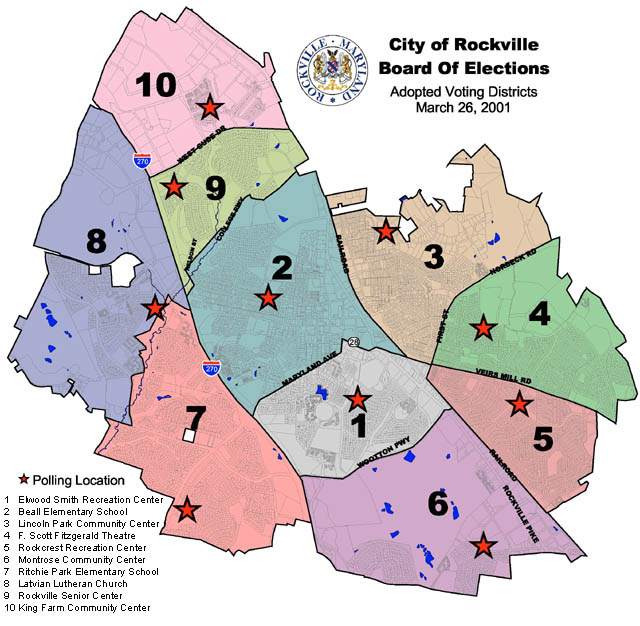
The corrected registration of the separate voting districts is shown with
those registered since the last election shown in grey. In the recent change
from 12 to 10 election districts only district 5 (which was district 6) remained
the same in size. District 2 is a combination of old district 1 and half of old
district 11. District 7 is a combination of old districts 8 and 9. A map of the
current election districts is included in this report.
The graph shows the fraction of new voters in a district and the relative
participation given by the ratio of ballots cast to registration (B/R) for that
district. The relationship between the two curves is not what one might expect.
While there is a positive correlation for districts 1,2, and 3, the negative
correlation for the rest of the districts is quite clear. The overall
correlation coefficient for the graph is -.44 (showing a slight negative
correlation). The graph also shows the participation (B/R) for 1999 for the same
districts. There is an obvious overall increase in participation from 199 to
2001. There are two additional things to look for here in comparison to the 1999
data:
1) Did the realignment of districts affect the participation? If one
considers the relative impact of changes in district number and changes in
polling place location, a relative larger impact should be felt on those areas
that experienced both changes. Starting with the largest impact, the expected
rank would be: 8,4,7,1,2,3,6,5,9,10. There is no indication of such an effect.
2) Was the support for Giammo correlated to a corresponding increase in
participation in those Districts where he did well? Although it is difficult to
separate the two effects on participation there is an indication that the
participation was not as high in districts 4 and 6 where Giammo did not do as
well and higher in 8 and 9 where Giammo did better.
The Mayoral Race
The graph shows the percentage of the vote the candidates obtained in the
districts, absentee ballots (A), and total. The large variation is striking. In
the four districts 2,3,8, and 9 Giammo led by a large amount but in the others
the race was close. To see the importance of district size on the outcome it is
instructive to plot the vote difference rather than the percentages.
This graph shows the vote difference between Giammo and Wright. Bars above
zero show the districts where Giammo had more votes than Wright, those below
zero show districts where Wright had more votes than Giammo. The highly
structured distribution of the vote difference shows the success of a strategy
based on selected areas rather than the whole city. In 1999 Wright had a total
vote of 3478. His vote in 2001 was 2936, a loss of 542 votes.
The following table compares the fraction of the vote Wright and Dorsey
received in 1999 and 2001.
| District |
Wright |
Dorsey |
Wright |
Dorsey |
|
1999 |
1999 |
2001 |
2001 |
| 2 |
.72 |
.74 |
.32 |
.69 |
| 7 |
.82 |
.75 |
.52 |
.83 |
| 8 |
.72 |
.67 |
.28 |
.61 |
| 9 |
.59 |
.65 |
.27 |
.70 |
The Council Races
The graph shows the fraction of the votes in each district for Wright and for
the average of the three council candidates running with him. Normally the
Mayoral candidate and the Council candidates on a slate running together and
endorsing each other have very similar vote patterns. Although the shapes are
the same it is clear that many people who voted for the slate council candidates
also voted for Giammo.
The vote for Wright was from 20% to 40% lower than the Average Council Slate
vote. The table above comparing the vote fractions of Wright and Dorsey
illustrates the same effect. It is particularly interesting to compare Wright
and Dorsey because they both served together as Councilmen during the 1999-2001
term and had very similar voting records.
A short note on the Vote Fraction shown for the Council in the above graph.
When the City reports on a vote percentage they show what fraction a candidate
got of the total votes for Council in that district. If all seven candidates got
the same number of votes then each candidate would get 14% of the vote. In such
an evenly matched race a candidate could win getting 15% of the vote. Since
there are 4 seats open the most needed to win is 25%. Thus, to win, one needs to
get between 15% and 25% of the vote (depending on how strong the other
candidates are). This seems odd as most people think in terms of more than 50%
as a win.
To make a comparison to the Mayoral race where 50% is the amount needed to
win, the fraction shown in the graph above is the ratio of average votes for the
three slate council candidates divided by the total vote for all council
candidates / four. The vote fractions for the graph below are calculated in the
same way. With this system the sum of the vote fractions in any district for all
council candidates is 4, as a consequence it is possible for a candidate to have
a vote fraction greater than one as shown below for Robbins in the plot of the
Council Races. There is good evidence that will be discussed later that this was
achieved by bullet balloting, that is, voting only for one council candidate
instead of 4. All winning Council Candidates received more votes than either
mayoral candidate in every district. In the past several elections the mayoral
candidate usually got more votes than any council candidate because there was no
substantial opposition in the mayoral race.
The Slate Council candidates, Dorsey, Hall, and Hoffmann show the same
pattern and were the top vote getters in 6 of the districts. Despite the
negative statements about slates by their opponents they appear to have carried
out a successful campaign showing the value of slates. There was an unspoken
working affiliation between Giammo, Robbins and Thomas but the correlation
analysis to be discussed later shows that there was no consistent benefit from
it. Thomas and Robbins did very well in their respective home districts but the
substantial vote for one did not benefit the other. Dorsey and Robbins were the
only incumbents in the race. It is interesting to note that they both increased
their vote over 1999 by the same amount, 31%.
As a newcomer with no support group, Henn presented a strong ideological
message with which many disagreed. However he did surprisingly well. Lih Young's
vote seems to be pretty constant averaging about 12%. This is the first time she
has run for council. In 1999 she got about 8% of the vote running for Mayor. The
spreadsheet shows the numerical vote totals for the candidates.
Bullet Balloting
When a council candidate asks supporters to vote only for them and not vote
for all or some of their other council choices it is called bullet balloting. It
can be easily shown that when running as an independent against a full slate
that it is almost impossible to win unless some strategy such as bullet
balloting or targeting a particular person on the opposition slate is used.
There are several clues that bullet balloting was employed by Robbins. The
first clue is that in the graph above Robbins makes a very strong showing in
district 8 at the same time that the three members of the slate simultaneously
go down by the same amount and none of the other candidates show a compensating
increase. The second clue is that Robbins got a vote fraction greater than one.
That is only possible if there is bullet balloting when the total vote count is
4 in calculating the vote fractions. The final clue is the missing ballots. If
all voters use their full 4 votes for council then the sum of the votes obtained
by the 7 candidates should add up to 4 times the number of ballots cast. The
figure shows the average number of missing ballots in each district and the
Robbins vote fraction. The shape similarity of the two curves shows that Robbins
initiated bullet balloting in all districts
This curve shows the actual Robbins vote and the number of missing ballots in
each district. This figure can be explained by either: 1) only 1/3 of the people
who voted for Robbins dropped 3 votes or 2) all of Robbins voters dropped only
one vote or 3) some combination of the above. It is impossible to tell from the
data which of the above is the more correct explanation of the missing votes.
Correlation Coefficients
Correlation coefficients (CC) are a mathematical tool for showing the
similarity of different sets of data. If the two sets of data are exactly alike
then the correlation coefficient is unity. If the two sets of data are
completely unrelated then the CC is zero. The more values in the data sets to be
compared, the better the chance that the CC has some significance. In analyzing
the Rockville election we can use the vote fractions in each district as a data
set with ten values and calculate the CC between the vote patterns of different
candidates to give us an indication of how much of the time voters chose both of
them. If we compared candidates A and B and got a CC of 0.3 that would imply
that about 30% of the time a voter chose A they would also choose B (and vice
versa). The following table shows the CC of the candidates.
|
Giammo |
Wright |
Dorsey |
Hall |
Henn |
Hoffmann |
Robbins |
Thomas |
Young |
| Giammo |
1 |
0 |
0 |
0 |
.35 |
0 |
.4 |
.26 |
.05 |
| Wright |
0 |
1 |
.9 |
.75 |
0 |
.75 |
0 |
0 |
0 |
| Dorsey |
0 |
.9 |
1 |
.92 |
0 |
.85 |
0 |
0 |
0 |
| Hall |
0 |
.75 |
.92 |
1 |
0 |
.83 |
0 |
0 |
0 |
| Henn |
.35 |
0 |
0 |
0 |
1 |
.09 |
0 |
0 |
0 |
| Hoffmann |
0 |
.75 |
.85 |
.83 |
.09 |
1 |
0 |
0 |
.04 |
| Robbins |
.4 |
0 |
0 |
0 |
0 |
0 |
1 |
0 |
.05 |
| Thomas |
.26 |
0 |
0 |
0 |
0 |
0 |
0 |
1 |
0 |
| Young |
.05 |
0 |
0 |
.01 |
0 |
.04 |
.05 |
0 |
1 |
Relationships between candidates that have no dependence on district will not
show up in a CC analysis. For instance if 25% of the voters in every district
that voted for Hall also voted for Giammo that fact would not show up in the CC
analysis.
Slate Splitting
A major effort was made in forums during the campaign to separate the mayoral
race from the Council race. It was successful in splitting off the mayoral race
from the council race to Wright's disadvantage. However, the slate Council
candidates maintained their identity as a slate with a small spread in the votes
between the three candidates. This figure shows a comparison of Mayor- Council
difference and differences between members of the slate running for Council. The
average gap between Mayoral and Council shown by the upper dashed line was 26%,
the average difference between maximum and minimum Council vote of slate
candidates, shown by the lower dashed line, was 7%.
While Giammo profited from the splitting of the slate, the non-slate Council
candidates, in general, did not. On average 38% of those that voted for Giammo
also voted for the slate Council candidates giving them a substantial margin of
victory. Vote Splitting
Vote Splitting
How did the voters decide to divide their vote between the 7 Council
candidates after they made their choice for mayor? The following table shows the
fraction of the vote given to each council candidate. The fractions should add
up to 4 because each voter had 4 votes for council candidates. This analysis is
facilitated by the large fluctuation in candidate preference from one district
to another.
| Candidate |
Giammo |
Wright |
| Dorsey |
.39 |
1.00 |
| Hall |
.47 |
.86 |
| Henn |
.55 |
.36 |
| Hoffmann |
.43 |
.89 |
| Robbins |
.75 |
.43 |
| Thomas |
.49 |
.16 |
| Young |
.13 |
.09 |
| Missing Ballots |
.80 |
.26 |
Note that Giammo voters gave 1.3 of their 4 votes to the slate council
candidates. Wright voters gave divided their fourth vote , giving 43% to
Robbins, 36% to Henn, and 16% to Thomas. The Wright voters only gave .25 of a
vote to non-slate candidates.
It is interesting to note that Giammo voters gave five times as many votes to
slate candidates than Wright voters gave to non-slate candidates.
Conclusions
1) The actual voting records of incumbent candidates have little impact on
election results
2) The participation was higher than the past five elections because there
was no opposition in those elections but was only slightly higher than the
elections of 1989 (Duncan vs. Johnson)
3) Slates are effective, even when the leader of the slate does not win; the
Council candidates are aided by the loyalty of voters to the slate.
4) Incumbents are usually reelected.
5) The number of absentee ballot requests can accurately predict the level of
voting on election day.
6) Bullet balloting can be easily detected and associated with supporters of
a candidate.
7) The redistricting had no noticeable effect on participation.
8) A candidate can win by concentrating on a couple of large districts, doing
well in them and either losing or doing relatively poorly in the rest.
The accompanying spreadsheet showing the data used in this analysis. Also
included is a map of the new election districts.
Roald A. Schrack
13 Farsta Ct.
Rockville, MD 20850
voice: 301-279-7017
fax: 301-279-8889
The 2001 Rockville Election
|
|
1 |
2 |
3 |
4 |
5 |
6 |
7 |
8 |
9 |
10 |
Abs |
CH |
Total |
|
Giammo |
369 |
889 |
264 |
291 |
311 |
142 |
484 |
418 |
509 |
118 |
100 |
31 |
3926 |
|
Wright |
428 |
410 |
165 |
318 |
303 |
217 |
520 |
161 |
192 |
96 |
100 |
26 |
2936 |
|
Dorsey |
582 |
781 |
298 |
443 |
439 |
290 |
709 |
276 |
412 |
153 |
161 |
44 |
4588 |
|
Hall |
544 |
810 |
276 |
423 |
414 |
256 |
648 |
274 |
392 |
159 |
148 |
30 |
4374 |
|
Henn |
407 |
678 |
225 |
269 |
204 |
139 |
453 |
248 |
324 |
85 |
87 |
27 |
3146 |
|
Hoffmann |
540 |
763 |
279 |
401 |
347 |
256 |
691 |
287 |
388 |
148 |
155 |
36 |
4291 |
|
Robbins |
457 |
820 |
234 |
384 |
386 |
248 |
557 |
465 |
459 |
105 |
117 |
28 |
4260 |
|
Thomas |
198 |
502 |
202 |
225 |
372 |
94 |
244 |
156 |
295 |
65 |
51 |
17 |
2421 |
|
Young |
99 |
152 |
65 |
58 |
73 |
59 |
106 |
96 |
71 |
37 |
9 |
15 |
840 |
|
Registration |
2748 |
4183 |
1964 |
3014 |
2638 |
2292 |
4112 |
2074 |
2153 |
1065 |
229 |
58 |
26530 |
|
No Inactives Reg |
2503 |
3893 |
1774 |
2794 |
2517 |
2122 |
3956 |
1937 |
1963 |
1046 |
|
|
24508 |
|
Ballots cast |
805 |
1312 |
437 |
618 |
626 |
377 |
1013 |
587 |
705 |
216 |
213 |
58 |
6967 |
|
Mayor Sum |
797 |
1299 |
429 |
609 |
614 |
359 |
1004 |
579 |
701 |
214 |
200 |
57 |
6862 |
|
Council Sum/4 |
706.75 |
1126.5 |
394.75 |
550.75 |
558.75 |
335.5 |
852 |
450.5 |
585.25 |
188 |
182 |
49.25 |
5980 |
|
Frac Miss Mayor |
0.01 |
0.01 |
0.02 |
0.01 |
0.02 |
0.05 |
0.01 |
0.01 |
0.01 |
0.01 |
0.06 |
0.02 |
0.02 |
|
Average Slate Council vote |
555.33 |
784.67 |
284.33 |
422.33 |
400.00 |
267.33 |
682.67 |
279.00 |
397.33 |
153.33 |
154.67 |
36.67 |
|
|
Average Slate Council frac. |
0.79 |
0.70 |
0.72 |
0.77 |
0.72 |
0.80 |
0.80 |
0.62 |
0.68 |
0.82 |
0.85 |
0.74 |
0.00 |
|
Miss Council votes |
393 |
742 |
169 |
269 |
269 |
166 |
644 |
546 |
479 |
112 |
124 |
35 |
3948 |
|
Council Slots dropped |
0.49 |
0.57 |
0.39 |
0.44 |
0.43 |
0.44 |
0.64 |
0.93 |
0.68 |
0.52 |
0.58 |
0.60 |
0.57 |
|
Voter participation |
0.29 |
0.31 |
0.22 |
0.21 |
0.24 |
0.16 |
0.25 |
0.28 |
0.33 |
0.20 |
0.93 |
1.00 |
0.26 |
|
Corrected Voter Part. |
0.32 |
0.34 |
0.25 |
0.22 |
0.25 |
0.18 |
0.26 |
0.30 |
0.36 |
0.21 |
|
|
0.28 |
|
Giammo-Wright |
-59 |
479 |
99 |
-27 |
8 |
-75 |
-36 |
257 |
317 |
22 |
0 |
5 |
990 |
|
Ballot Fraction: |
|
|
|
|
|
|
|
|
|
|
|
|
|
|
Giammo |
0.46 |
0.68 |
0.62 |
0.48 |
0.51 |
0.40 |
0.48 |
0.72 |
0.73 |
0.55 |
0.50 |
0.54 |
0.57 |
|
Wright |
0.54 |
0.32 |
0.38 |
0.52 |
0.49 |
0.60 |
0.52 |
0.28 |
0.27 |
0.45 |
0.50 |
0.46 |
0.43 |
|
Dorsey |
0.82 |
0.69 |
0.75 |
0.80 |
0.79 |
0.86 |
0.83 |
0.61 |
0.70 |
0.81 |
0.88 |
0.89 |
0.77 |
|
Hall |
0.77 |
0.72 |
0.70 |
0.77 |
0.74 |
0.76 |
0.76 |
0.61 |
0.67 |
0.85 |
0.81 |
0.61 |
0.73 |
|
Henn |
0.58 |
0.60 |
0.57 |
0.49 |
0.37 |
0.41 |
0.53 |
0.55 |
0.55 |
0.45 |
0.48 |
0.55 |
0.53 |
|
Hoffmann |
0.76 |
0.68 |
0.71 |
0.73 |
0.62 |
0.76 |
0.81 |
0.64 |
0.66 |
0.79 |
0.85 |
0.73 |
0.72 |
|
Robbins |
0.65 |
0.73 |
0.59 |
0.70 |
0.69 |
0.74 |
0.65 |
1.03 |
0.78 |
0.56 |
0.64 |
0.57 |
0.71 |
|
Thomas |
0.28 |
0.45 |
0.51 |
0.41 |
0.67 |
0.28 |
0.29 |
0.35 |
0.50 |
0.35 |
0.28 |
0.35 |
0.40 |
|
Young |
0.14 |
0.13 |
0.16 |
0.11 |
0.13 |
0.18 |
0.12 |
0.21 |
0.12 |
0.20 |
0.05 |
0.30 |
0.14 |
|
Council (team/all others) |
1.43 |
1.09 |
1.17 |
1.35 |
1.16 |
1.49 |
1.51 |
0.87 |
1.04 |
1.58 |
1.76 |
1.26 |
1.24 |
|
C Team STD |
0.03 |
0.02 |
0.02 |
0.03 |
0.07 |
0.05 |
0.03 |
0.01 |
0.02 |
0.02 |
0.03 |
0.12 |
0.02 |
|
C Team AVE |
0.79 |
0.70 |
0.72 |
0.77 |
0.72 |
0.80 |
0.80 |
0.62 |
0.68 |
0.82 |
0.85 |
0.74 |
0.74 |
|
|
|
|
|
|
|
|
|
|
|
|
|
|
|
Abs = Absentee Ballots
CH = Election Day Registration at City Hall