 |
Rockville
City Elections 2003
Election Analysis |
|
Alternatively, you may also view this document
by selecting one of the following files.
elec2003.doc
(Microsoft Word Document, 253KB)
elec2003.pdf
(Adobe Portable Document Format (PDF), 344KB)
The vote tallies and calculations used in this report are available in the
following file.
elec2003.xls
(Microsoft Excel Spreadsheet, 25KB)
|
Rockville Election Analysis 2003
Roald A. Schrack
Election Day, Tuesday, November 4 was an unseasonably warm sunny day. This
was the first election since 1987 to be fully contested, have 2 mayoral
candidates and 8 Council candidates for the 4 Council seats. This was the first
election since 1954 that did not have candidates running as slates. This was the
first Rockville election to use the new touch-screen voting machines.
The political campaign leading up to the election was fairly lackluster with
the challenging mayoral candidate, Russ Hamill, throwing his hat in the ring
just before the September 5th deadline. There was little political activity
during the summer. Activity picked up on September 30 when the first of six
public forums took place, with 3 of them rebroadcast on the City cable channel
11. Absentee ballots, which are a reliable indicator of interest in the election
started quite slowly, with only 33 received two weeks before the election. As
the following table shows, the turnout was a little above average but not as
high as the 2001 election. The values given for registration do not include
inactive voters. Previous voters refers to those that have voted in at least one
of the last four elections. New registration means those that have been added
since the last election.
|
Year |
Ballots |
Registration |
B/R |
Previous Voters |
New Registration |
|
1987 |
8056 |
23,601 |
.34 |
|
|
|
1989 |
6206 |
23,546 |
.26 |
9394 |
2258 |
|
1991 |
5451 |
20,648 |
.26 |
7916 |
1741 |
|
1993 |
1449 |
23,077 |
.06 |
9889 |
4409 |
|
1995 |
4323 |
22,787 |
.19 |
8133 |
1317 |
|
1997 |
5211 |
22,660 |
.22 |
6968 |
3299 |
|
1999 |
4690 |
22,676 |
.21 |
6898 |
1451 |
|
2001 |
6967 |
24,423 |
.28 |
6704 |
3820 |
|
2003 |
6170 |
26,198 |
.24 |
8372 |
3004 |
The average absentee ballots to polling place ballot ratio for the last 5
elections on clear days is .031±.002. Rainy weather reduces the turnout as much
as 35%. The predictive quality of the absentee ballot count remained, although
many absentee ballots came in the last couple of days.
|
Year |
Absentee Ballots |
Absentee Ballots/ Polling Place Ballots |
|
1989 |
175 |
.028 |
|
1991 |
168 |
.032 |
|
1993 |
48 |
.033 |
|
1995 |
180 |
.042 rain |
|
1997 |
156 |
.031 |
|
1999 |
171 |
.038 rain |
|
2001 |
213 |
.030 |
|
2003 |
192 |
.031 |
A spreadsheet shows the results of the election on the last page of this
report.
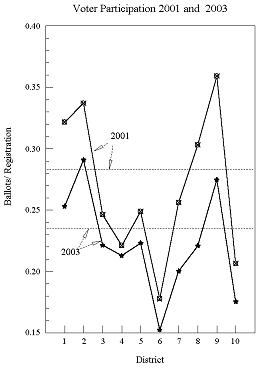 Voter Participation
The adjacent graph gives the ratio of ballots to the number of registered
voters in a district. This ratio is termed Voter Participation. Data is shown
for both this and the last election. Note the wide range in voter participation.
The patterns shown persist from election to election reflecting the demographics
of the different districts. Similar persistent differences are experienced in
the different councilmanic districts in the county. The exceptionally low
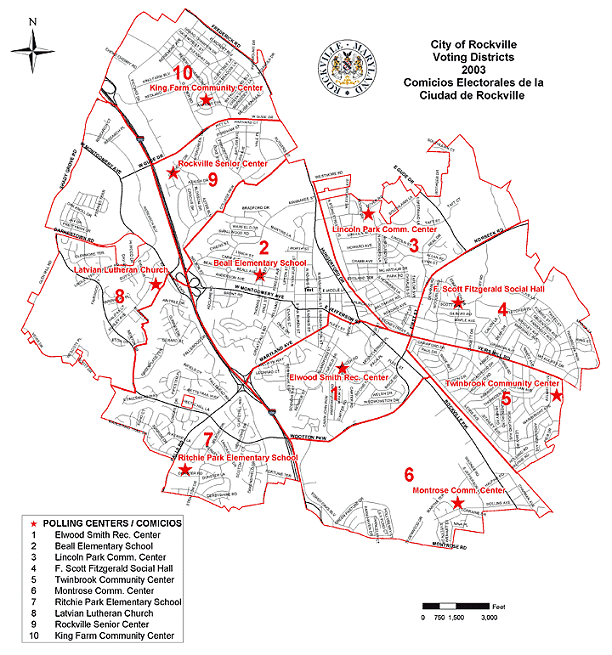
participation in district 6 is related to three factors. 1) The voters that live
in the North Farm part of the district must travel quite a distance to the
polling place. 2) There is an ethnic concentration with low voting probability
in the garden apartments behind Congressional Shopping Center. 3) The residents
in Congressional Towers, as all apartment residents, have lower probability of
voting.
District 10 residents are mostly apartment dwellers who participate at a low
level. Districts 1,2,8, and 9 where many politically active citizens live
historically have had high levels of participation. The dashed lines show the
city average voter participation for the indicated years.
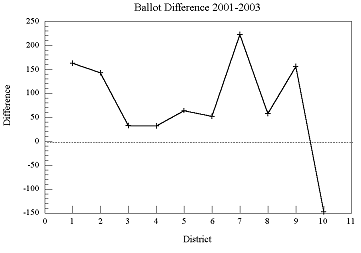 This graph shows the absolute
ballot difference between the 2001 and 2003 election. Note that only district 10
had more ballots in 2003 than 2001. Even so the voter participation was lower in
2003 than 2001 because of the increase in registered voters there from 1065 in
2001 to 2070 in 2003.
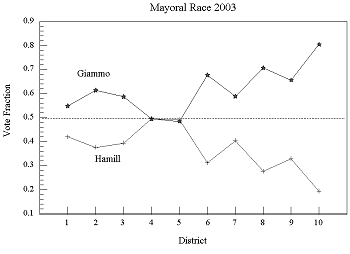 Mayoral Race
The adjacent graph shows the ballot fraction for the two candidates. Giammo
lost in district 5 by four votes and was tied by Hamill in 4. For getting in the
race so late and with little previous public exposure, Hamill did extremely
well. His voters come from two main groups.
1) Personal relationships and the few who actually supported his platform of
delaying town center development.
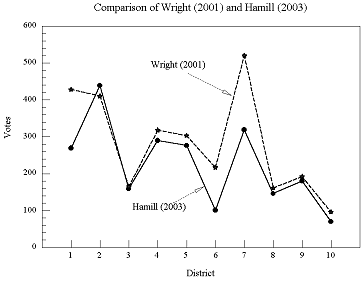 2) Voters that supported Bob
Wright in 2001. The next graph shows the votes received by Bob Wright in 2001
and the votes received by Hamill. Note the extreme similarity in the shapes.
About 80% of the people who voted for Wright, voted for Hamill.
Giammo got 3926 votes in 2001 and 3736 in 2003, a net loss of 190 votes or
4.8%. The total vote dropped by about 13% so relatively speaking Giammo more
than held his own in general level of acceptance.
The Referendum
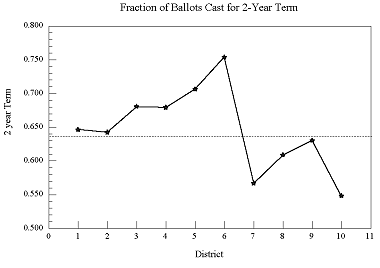 The 2-year term won easily,
receiving about 64% of the vote. The vote by district is shown in the
accompanying graph. The vote was probably influenced by some last minute
publicity put out by a group entitled the "Rockville Coalition for
Responsive Government". It is extremely unusual for so much money to be
spent on an advisory referendum as was spent on the two full color expensive
mailings. It will be interesting to see who thought it was so important to
prevent four-year terms.
The Council Races
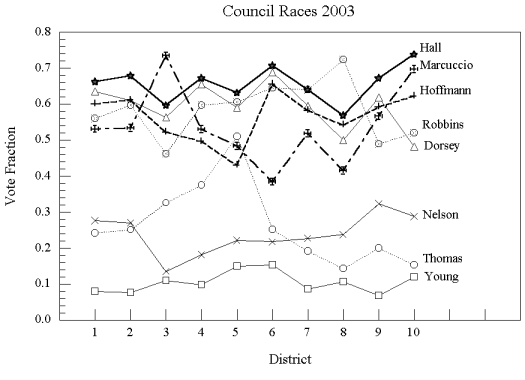
The above graph shows the vote fraction received by the eight candidates for
council. If you add up all the values for the different candidates plus the
Missing Fraction (due to voters not voting for all four council seats) for a
district you will get a total of 4. The city uses a different system in which
the total is 1. The structureless appearance of the graph is caused by the lack
of slates. The relationships between candidates are highly dependent on the
district and the strategy used by the supporters of a candidate in that
district. Considering the weaker candidates first: Young went from 840 votes in
2001 to 602 in 2003, a percentage drop about twice the overall vote.
Harry Thomas went from 2421 in 2001 to 1619 in 2003, an even greater
percentage drop than Young. His only bright spot was in his home district.
Nelson, running for the first time, and only living in the city for about a
year, got 1486 votes. He will probably do much better if he runs again with more
experience and name recognition. It is hard to believe that these candidates
motivated any significant voter turnout.
The major races were between the remaining five candidates, four incumbents
plus one challenger. Unless the challenger targets one of the incumbents, it is
almost impossible for a challenger to win. Consider a voter has four ballots and
votes one of them for the challenger. If the voter has no specific incumbent to
drop, the three remaining votes will be scattered randomly among the four
incumbents. Call this voter A. Consider a second voter, B, that is not voting
for the challenger and votes for all the incumbents. If there are 12 type A and
12 type B voters then the final vote tally will be: Challenger 12 votes,
Incumbents 21 votes each. If the incumbents are all equally probable of
reelection the challenger must get 83% of the vote to win. In this case of 24
total voters, 20 must vote for the challenger. It is rare for the incumbents to
be evenly matched, the closest approach to it occurred in districts 6 and 7
where the incumbent votes were all within a 10% range, probably due to
intentional slating instigated at the district level. The data does not indicate
any attempt at intentional slating of the incumbents in any other districts.
For those candidates that ran in both 2001 and 2003, a comparison was made of
their relative vote in the two elections. The only outstanding change was a 55%
increase in district 6 for Giammo. This undoubtedly was due to a switch in the
proposed vote list handed out at the polling place from Wright in 2001 to Giammo
in 2003.
 Missing Ballots
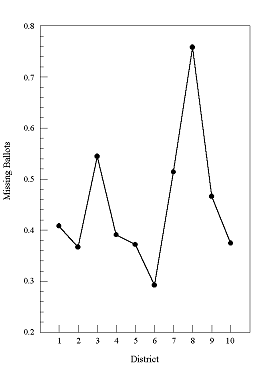
To enhance the probability of winning for a chosen candidate, voters may
choose not to vote their allotted four votes. This is called "bullet
balloting". The adjacent graph shows the missing ballots for the different
districts. There will always be voters who cannot make up their mind on a fourth
candidate to vote for, so there are always a few missing ballots. From the
number of missing ballots alone it is not possible to tell if .3 means that 10%
of the voters only voted for one candidate or 30% of the voters only voted for 3
candidates. If only one candidate is voted for, then the vote totals for that
candidate are elevated at the expense of the other candidates. The graph shows
that in districts 3 and 8 there was an obvious special effort made at bullet
balloting. Going back to the graph showing the vote fractions, it can be seen
that Marcuccio was the beneficiary in district 3 and that Robbins was the
beneficiary in district 8. In both cases these are the home districts of the
candidates and in both cases the vote fractions of all other candidates are
depressed. Another indicator of bullet balloting for a specific candidate is the
great difference of the winning candidate from the other candidates. In district
3 Marcuccio is 32% higher than the average of the next 3 candidates. In district
8 Robbins is 34% higher than the next three candidates.
Conclusions
1) The absentee ballot count is a good predictor of the final turnout.
2) Voter turnout was not as great as 2001 even though there were more council
candidates in addition to a mayoral challenger. Much less money was spent on the
2003 campaign. An analysis of the campaign funding will be made after the
December 4th final financial reports.
3) Giammo seems to have satisfied his supporters and to have retained their
votes (and actually increase his relative vote strength).
4) Hamill attracted about 80% of those who voted for Wright in 2001. This was
the major component of his strength.
5) Hamill’s platform of cutting back on Town Center development seemed to
be ignored by those who endorsed him and voted for him. Was his platform taken
seriously, or was he simply seen as a way to show disapproval of Giammo?
6) The lack of slates developed by the candidates does not prevent supporters
of candidates from developing local suggested slates in the separate districts.
7) In addition to slates, bullet balloting took place in separate districts
for different candidates.
8) Sample ballots handed out to voters at the polling place can strongly
affect the vote.
9) New voting machines caused no trouble.
10) The lack of official slates left local activists the opportunity to form
slates and/or endorse bullet balloting as they saw fit. Incumbents had a great
advantage in this environment.
11) It is extremely difficult for an independent challenger to win against
incumbents.
12) The existence of more candidates does not increase turnout unless the
candidates excite interest.
|
District |
1 |
2 |
3 |
4 |
5 |
6 |
7 |
8 |
9 |
10 |
Same Day |
Absentee |
Total |
|
Giammo |
352 |
717 |
237 |
290 |
272 |
220 |
465 |
374 |
360 |
292 |
38 |
119 |
3736 |
|
Hamill |
269 |
439 |
159 |
290 |
276 |
101 |
319 |
146 |
180 |
70 |
19 |
64 |
2332 |
|
Mayor write-ins |
5 |
1 |
0 |
0 |
5 |
1 |
1 |
0 |
0 |
0 |
0 |
0 |
13 |
|
Dorsey |
408 |
713 |
228 |
384 |
332 |
224 |
471 |
265 |
340 |
175 |
24 |
136 |
3700 |
|
Hall |
425 |
794 |
241 |
394 |
355 |
230 |
506 |
301 |
369 |
268 |
27 |
132 |
4042 |
|
Hoffmann |
386 |
715 |
211 |
291 |
242 |
213 |
460 |
287 |
325 |
226 |
29 |
126 |
3511 |
|
Marcuccio |
341 |
624 |
297 |
311 |
272 |
125 |
410 |
220 |
311 |
253 |
32 |
106 |
3302 |
|
Nelson |
178 |
317 |
55 |
107 |
125 |
71 |
180 |
126 |
178 |
105 |
16 |
28 |
1486 |
|
Robbins |
360 |
699 |
187 |
350 |
341 |
210 |
506 |
383 |
269 |
189 |
30 |
100 |
3624 |
|
Thomas |
156 |
294 |
132 |
220 |
287 |
82 |
152 |
76 |
110 |
56 |
9 |
45 |
1619 |
|
Young |
52 |
91 |
45 |
58 |
85 |
50 |
69 |
57 |
38 |
44 |
7 |
6 |
602 |
|
Council write-ins |
2 |
6 |
2 |
0 |
12 |
0 |
4 |
1 |
0 |
1 |
0 |
1 |
29 |
|
Referendum 2 |
415 |
751 |
275 |
398 |
397 |
245 |
448 |
322 |
346 |
199 |
39 |
96 |
3931 |
|
Referendum 4 |
221 |
412 |
120 |
181 |
162 |
77 |
331 |
200 |
202 |
161 |
19 |
87 |
2173 |
|
Registration |
2538 |
4018 |
1826 |
2754 |
2519 |
2133 |
3947 |
2395 |
1998 |
2070 |
|
|
26198 |
|
Ballots cast |
642 |
1169 |
404 |
586 |
562 |
325 |
790 |
529 |
549 |
363 |
59 |
192 |
6170 |
|
Mayor sum |
621 |
1156 |
396 |
580 |
548 |
321 |
784 |
520 |
540 |
362 |
57 |
183 |
6068 |
|
Council sum |
2306 |
4247 |
1396 |
2115 |
2039 |
1205 |
2754 |
1715 |
1940 |
1316 |
174 |
679 |
21886 |
|
Missed Coun. Votes |
262 |
429 |
220 |
229 |
209 |
95 |
406 |
401 |
256 |
136 |
62 |
89 |
2794 |
|
Voter Participation |
0.25 |
0.29 |
0.22 |
0.21 |
0.22 |
0.15 |
0.20 |
0.22 |
0.27 |
0.18 |
|
|
0.24 |
| |
|
|
|
|
|
|
|
|
|
|
|
|
|
|
Ballot Fraction |
|
|
|
|
|
|
|
|
|
|
|
|
|
|
Giammo |
0.55 |
0.61 |
0.59 |
0.49 |
0.48 |
0.68 |
0.59 |
0.71 |
0.66 |
0.80 |
0.64 |
0.62 |
0.61 |
|
Hamill |
0.42 |
0.38 |
0.39 |
0.49 |
0.49 |
0.31 |
0.40 |
0.28 |
0.33 |
0.19 |
0.32 |
0.33 |
0.38 |
|
Dorsey |
0.64 |
0.61 |
0.56 |
0.66 |
0.59 |
0.69 |
0.60 |
0.50 |
0.62 |
0.48 |
0.41 |
0.71 |
0.60 |
|
Hall |
0.66 |
0.68 |
0.60 |
0.67 |
0.63 |
0.71 |
0.64 |
0.57 |
0.67 |
0.74 |
0.46 |
0.69 |
0.66 |
|
Hoffmann |
0.60 |
0.61 |
0.52 |
0.50 |
0.43 |
0.66 |
0.58 |
0.54 |
0.59 |
0.62 |
0.49 |
0.66 |
0.57 |
|
Marcuccio |
0.53 |
0.53 |
0.74 |
0.53 |
0.48 |
0.38 |
0.52 |
0.42 |
0.57 |
0.70 |
0.54 |
0.55 |
0.54 |
|
Nelson |
0.28 |
0.27 |
0.14 |
0.18 |
0.22 |
0.22 |
0.23 |
0.24 |
0.32 |
0.29 |
0.27 |
0.15 |
0.24 |
|
Robbins |
0.56 |
0.60 |
0.46 |
0.60 |
0.61 |
0.65 |
0.64 |
0.72 |
0.49 |
0.52 |
0.51 |
0.52 |
0.59 |
|
Thomas |
0.24 |
0.25 |
0.33 |
0.38 |
0.51 |
0.25 |
0.19 |
0.14 |
0.20 |
0.15 |
0.15 |
0.23 |
0.26 |
|
Young |
0.08 |
0.08 |
0.11 |
0.10 |
0.15 |
0.15 |
0.09 |
0.11 |
0.07 |
0.12 |
0.12 |
0.03 |
0.10 |
|
Total Council fraction |
3.59 |
3.63 |
3.46 |
3.61 |
3.63 |
3.71 |
3.49 |
3.24 |
3.53 |
3.63 |
2.95 |
3.54 |
3.55 |
|
Missed Council fraction |
0.41 |
0.37 |
0.54 |
0.39 |
0.37 |
0.29 |
0.51 |
0.76 |
0.47 |
0.37 |
1.05 |
0.46 |
0.45 |
|
Total Council fraction |
4.00 |
4.00 |
4.00 |
4.00 |
4.00 |
4.00 |
4.00 |
4.00 |
4.00 |
4.00 |
4.00 |
4.00 |
4.00 |
|
Average of Winners |
0.615 |
0.625 |
0.605 |
0.615 |
0.585 |
0.678 |
0.615 |
0.583 |
0.613 |
0.645 |
0.5 |
0.653 |
0.605 |
|
Standard deviation of W. |
0.038 |
0.032 |
0.083 |
0.056 |
0.045 |
0.024 |
0.026 |
0.083 |
0.038 |
0.084 |
0.029 |
0.062 |
0.034 |
 Voter Participation
 This graph shows the absolute
ballot difference between the 2001 and 2003 election. Note that only district 10
had more ballots in 2003 than 2001. Even so the voter participation was lower in
2003 than 2001 because of the increase in registered voters there from 1065 in
2001 to 2070 in 2003.
 Mayoral Race
 2) Voters that supported Bob
Wright in 2001. The next graph shows the votes received by Bob Wright in 2001
and the votes received by Hamill. Note the extreme similarity in the shapes.
About 80% of the people who voted for Wright, voted for Hamill.
 The 2-year term won easily,
receiving about 64% of the vote. The vote by district is shown in the
accompanying graph. The vote was probably influenced by some last minute
publicity put out by a group entitled the "Rockville Coalition for
Responsive Government". It is extremely unusual for so much money to be
spent on an advisory referendum as was spent on the two full color expensive
mailings. It will be interesting to see who thought it was so important to
prevent four-year terms.
 Missing Ballots